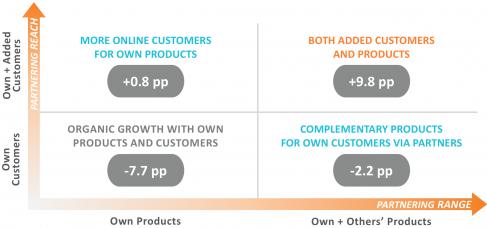
MIT CISR research has shown that companies have a choice of four digital business models to create value and make money in the digital era.[foot]Peter Weill and Stephanie L. Woerner, What’s Your Digital Business Model?: Six Questions to Help You Build the Next-Generation Enterprise (Boston: Harvard Business Review Press, 2018), https://cisr.mit.edu/publication/whats-your-digital-business-model.[/foot] Companies that choose a modular producer business model[foot]S. L. Woerner, I. M., Sebastian, and P. Weill, “All Companies Need a Modular Producer Strategy,” MIT Sloan CISR Research Briefing, Vol. XIX, No. 2, February 2019, https://cisr.mit.edu/publication/2019_0201_ModularProducer_WoernerSebastianWeill. [/foot] provide innovative digitized products to the customers of ecosystem drivers and omnichannel companies—a digital strategy to grow reach via partners.[foot]I. M. Sebastian, P. Weill, and S. L. Woerner, “Three Strategies to Grow via Digital Partnering,” MIT Sloan CISR Research Briefing, Vol. XX, No. 5, May 2020, https://cisr.mit.edu/publication/2020_0501_DigitalPartneringStrategies_SebastianWeillWoerner.[/foot]
In a 2019 survey[foot]MIT CISR 2019 Top Management Teams and Transformation survey, N=1,311.[/foot] we found that companies with a modular producer business model performed better relative to their industry than companies with an omnichannel or supplier business model. In financial services, for example, modular producers had an average revenue growth of 14.9 percentage points and an average net margin of 9.6 percentage points above industry average—a significant premium.[foot]The quantitative analysis is based on the MIT CISR 2019 Top Management Teams and Transformation survey, N=1,311; financial services companies N=277. Financial services companies categorized based on dominant business model: ecosystem drivers 16%, modular producers 11%, omnichannel 12%, suppliers 61%. Financial services revenue growth percentage points above/below industry average: ecosystem drivers +24.3, omnichannel -9.3, suppliers -11.1; net profit margin: ecosystem drivers +16.6, omnichannel -2.1, suppliers -7.4. Net profit margin and revenue growth are compared to industry and are 5% mean trimmed to eliminate outliers. Self-reported net profit margin/revenue growth correlate significantly with actual profit margin/revenue growth at the p<.01 level. [/foot] Given these benefits, we believe that in the next five years many large traditional companies in financial services and beyond will experiment with adding modular producer offerings to complement their already successful established business models.


