In an activity as uncertain as digitally transforming a large organization, knowing where you are is as important as knowing where you want to go. To know where you are requires two important types of measures: those that indicate transformation success, such as progress and value creation; and those that track effectiveness at building capabilities future-ready companies must have to thrive in the digital era. The best tool we have seen companies use to know where they are is real-time dashboarding. In our analysis of over one thousand companies, those that were more effective at dashboarding were also better at most other important measures, including innovation, growth, and margin relative to industry. In this briefing we share MIT CISR research on dashboarding, illustrating our findings using a case study from Schneider Electric.

Dashboarding Pays Off
Abstract
In a digital business transformation, knowing where you are is as important as knowing where you want to go. To know where you are requires two important types of measures: those that indicate transformation success, such as progress and value creation; and those that track effectiveness at building capabilities future-ready companies must have to thrive in the digital era. The best tool we have seen companies use to know where they are is real-time dashboarding. In this briefing we share MIT CISR research on dashboarding, illustrating our findings using a case study from Schneider Electric.
Companies That Are Highly Effective at Dashboarding Outperform
In an analysis of recent MIT CISR survey data[foot]MIT CISR 2019 Top Management Teams and Transformation Survey (N=1311).[/foot] to explore the impacts of dashboarding, we found that companies with top quartile dashboard effectiveness significantly outperformed bottom quartile companies on five internal and five external measures of performance (see figure 1). There are lots of reasons why dashboarding is so effective, but perhaps the most important is that everybody in the company gets to see how it is doing against agreed-upon metrics and works together to make course corrections when necessary.
Figure 1: Companies That Are Highly Effective at Dashboarding Outperform
| Measures of Performance | Bottom Quartile Dashboard Effectiveness | Top Quartile Dashboard Effectiveness |
|---|---|---|
| INTERNAL | ||
| Percent complete on transformation | 39% | 63% |
| Percent effectiveness of the future-ready drivers | 40% | 78% |
| Effectiveness of leaders in moving orientation from Command and Control to Coach and Communicate | 35% | 78% |
| Effectiveness of leaders at holding people accountable | 40% | 75% |
| Employee experience, compared to industry | 51% | 65% |
| EXTERNAL | ||
| Net profit margin, compared to industry1 | -9.4 pp | 8.4 pp |
| Revenue growth, compared to industry1 | -13.4 pp | 11.0 pp |
| Percentage of revenues from innovations introduced in the last three years | 22% | 49% |
| Percentage of revenues from cross-selling | 20% | 46% |
| Customer experience, compared to industry | 51% | 66% |
Source: MIT CISR 2019 TMT and Transformation Survey (N=1311).
1 Self reported net profit margin/revenue growth correlates significantly with actual profit margin/revenue growth at the p<.01 level.
We propose that an effective dashboard monitors two aspects of value from digital:
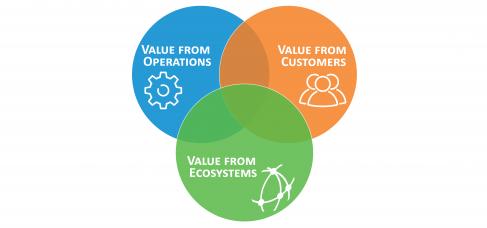
- What value is created, tracking this over time[foot]For an explanation of the three types of value from digital to track in a dashboard—operational, customer and ecosystem—see I. M. Sebastian, P. Weill, and S. L. Woerner, “Three Types of Value Drive Performance in Digital Business,” MIT Sloan CISR Research Briefing, Vol. XXI, No. 3, March 2021, https://cisr.mit.edu/publication/2021_0301_ValueinDigitalBusiness_SebastianWeillWoerner.[/foot]
- How value is created via the development of organizational and individual capabilities
The combination of the what and how of creating value from digital drives the company toward becoming future ready. Schneider Electric tracks these aspects in a dashboard the company created that it calls the “Digital Flywheel.”
Schneider Electric Tracks Value Creation with Its Digital Flywheel
Schneider Electric SE[foot]This case study on dashboarding at Schneider Electric draws from interviews with senior executives at the company in late 2021.[/foot] is a €25 billion revenue company providing energy and automation digital solutions for efficiency and sustainability.[foot]Schneider Electric SE, “2020 Annual Report,” March 23, 2021, from the Schneider Electric website, https://www.se.com/ww/en/assets/564/document/235840/schneider-annual-report-2020-full-report.pdf.[/foot] In 2021, a media and research firm focused on corporate sustainability ranked Schneider Electric as the world’s most sustainable corporation.[foot]Corporate Knights ranked Schneider Electric at #1 in its 2021 Global 100 index of the world’s most sustainable corporations. Mike Scott, “Top company profile: Schneider Electric leads decarbonizing megatrend,” Corporate Knights, January 25, 2021, https://www.corporateknights.com/leadership/top-company-profile-schneider-electric-leads-decarbonizing-megatrend25289/.[/foot] Over the last decade, Schneider Electric has transformed itself from a seller of energy-related products to a digital leader in providing energy efficiency services.
For Schneider and its customers, the combination of the sustainability of electrification and the efficiency gains that digitization supports offers great new value creation potential. To implement this strategy, Schneider created EcoStruxureTM, an IoT-enabled plug-and-play customer engagement system delivering energy efficiency as a service for use in places such as buildings, factories, and data centers. The EcoStruxture system translates data into actionable intelligence by collecting structured (from sensors) and unstructured (from logs completed by maintenance people) data from the set of Schneider Electric products at a customer site and analyzing the data. This produces a set of real-time instructions that the system sends back to the customer site. EcoStruxure and other capabilities have enabled Schneider Electric to move from selling products to selling more services. These services can make a big difference in customer sites; for example, companies using Schneider Electric’s energy efficiency services report a thirty percent reduction in energy consumption.[foot]Schneider Electric SE, “Bridging Progress and Sustainability for All: 2020–2021 Sustainability Report,” from the Schneider Electric website, https://download.schneider-electric.com/files?p_Doc_Ref=SustainabilityReport2020EN.[/foot]
Achieving this kind of transformation in a large organization requires a way for everyone to understand the organization’s goals, metrics, and business logic and how they fit together. For Schneider Electric the Digital Flywheel provided such guidance, becoming a tool to help drive the transformation.
Schneider Electric first represented its dashboard as a “Digital Barometer” that measured what value was created from digital. But soon senior leaders realized that something additional was needed—the business logic of how value, including sales, was to be created—to help internal and external stakeholders understand why particular metrics were important. This led to the creation of the Digital Flywheel, which describes and tracks how value is created via digital. The Digital Flywheel has four key components, representing the four parts of the EcoStruxure system (see figure 2):
- Connectable Products: all the energy-related systems and devices in a building including heating and cooling systems, ventilation, and thermostats. These products supply data for analysis, and receive and act on instructions.
- Edge Control: a software and monitoring solutions layer that gives organizations the ability to coordinate and manage the connectable products.[foot]“Schneider Electric Launches Next Generation of EcoStruxure™, the Architecture and Platform for End-to-End IoT-Enabled Solutions at Scale,” Schneider Electric Press Release, November 29, 2016, on the Cision by PR Newswire website, https://www.prnewswire.com/news-releases/schneider-electric-launches-next-generation-of-ecostruxure-the-architecture-and-platform-for-end-to-end-iot-enabled-solutions-at-scale-300369412.html; and “An Introduction to Schneider Electric’s EcoStruxureTM,” Schneider Electric, February 9, 2018, video, https://www.youtube.com/watch?v=4RMV1VAJvVs.[/foot]
- Digital & Software: a layer of intelligence and software that performs analytics and generates energy efficiency dashboards in real time. Besides connectable Schneider products, the software can also manage competitor and complementary physical products. Analyses of product-generated data identify additional needs and opportunities.
- Field Services: teams that implement Schneider products and services.
Figure 2: Schneider Electric Tracks Value Creation with Its Digital Flywheel
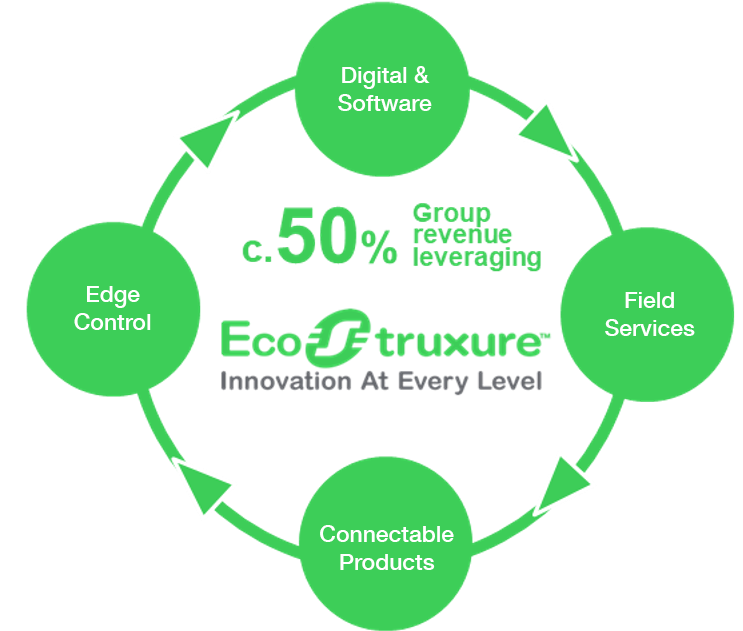
Source: Schneider Electric SE; used with permission.
On the Digital Flywheel, Schneider Electric captures and tracks financial performance both for the four components individually and combined. But just as important is that it shows how the four components work together to produce higher value and sales for the company—and increased value for clients, often measured as energy efficiency improvement. Total company revenues generated via EcoStruxure have grown from a very small percentage following its debut in 2016 to fifty percent in 2021—an industry-leading achievement and a tangible illustration of Schneider Electric’s shift from mostly product sales to selling both products and services.
[The Digital Flywheel] forces a conceptual convergence, a common vocabulary and a common understanding, a common measurement. When you put the things together you get good momentum, and you win together.
Jean-Pascal Tricoire, Chief Executive Officer, Schneider Electric SE
Dashboard Effectively by Applying Five Lessons
Schneider Electric’s use of the Digital Flywheel has changed how the company is managed. We examined the company’s development and use of the Flywheel and surfaced five lessons:
- Combine both what and how. In creating the Digital Flywheel, it took Schneider Electric many rounds of iteration to arrive at the effective version. What makes the Digital Flywheel compelling is how it combines what the company should measure with the business logic of how the value is created.
- Persist. It takes time to get an organization to adopt and use a dashboard. Schneider Electric, like most companies that successfully use dashboards, went through phases where people resisted using it. Eventually company executives reached agreement on common definitions and metrics for the drivers of business success. Once such agreement is reached, people can use a dashboard as a team tool to understand how their group operates and connects to the performance of other groups.
- Use the dashboard to manage the company. At Schneider Electric, CEO Jean-Pascal Tricoire uses the Digital Flywheel in his quarterly reviews with each business leader. The conversations typically start with covering what has worked well and then move to areas that need additional focus. The Digital Flywheel provides a common language for use across the entire company—even by the board, in their digital subcommittee. Recently the Digital Flywheel was used in Schneider Electric’s Investor Relations presentation to demonstrate how digital and services combine to create a compelling vision proposition.[foot]Jean-Pascal Tricoire, “Accelerating” (presentation, Capital Markets Day 2021, Rueil-Malmaison, France, November 30, 2021), https://www.se.com/ww/en/assets/564/document/260776/accelerating-jean-pascal-tricoire-2021-cmd.pdf.[/foot]
- Communicate to the entire company how to use the dashboard. Getting an entire large company to effectively use a dashboard requires wide-ranging, consistent communication. To reach its 135,000 employees, Schneider Electric used a variety of ways to broadcast the message. One successful approach was a monthly newsletter focused on the Digital Flywheel. A recent edition had a section titled “Behind the Data in the Flywheel,” with an interview of a senior Schneider Electric executive explaining the different types of churn and what actions can minimize churn. The goal was not only to further the use of the Flywheel but also improve the company’s performance on the metrics.
- Automate, with drill-down capabilities. As the dashboard moves closer to sharing real-time data with added capabilities to drill down into business and operational segments, it will become more effective and useful in company decision making and ease course correction moving forward. At Schneider Electric, much of the data is real time, and the dashboard filter panel displays the source of the data being examined and options to drill down on geography, business scope, and more.
Invest in Dashboarding to Realize New Value
In dashboarding, like many other digital initiatives, seeking perfection is the enemy of progress. The data won’t be perfect or even agreed-upon in the first few rounds of creating your dashboard. Even more challenging will be changing the culture to use a central dashboard rather than local numbers. Plus changing how you do management reviews with real-time dashboards will take time and reinforcement. But perhaps the most challenging and important effort will be articulating the business logic that shows how value is created and captured by the company. Including that business logic in a dashboard demonstrates that the leadership really has invested sufficient time and experience in understanding how digital will create new value for the company. Companies that have been successful with dashboarding typically started using the tool to measure and course correct a digitally enabled business transformation, but it eventually became the way to run the business.
© 2022 MIT Sloan Center for Information Systems Research, Weill and Woerner. MIT CISR Research Briefings are published monthly to update the center's patrons and sponsors on current research projects.
Related Publications


About the Authors

Peter Weill, Chairman and Senior Research Scientist, MIT Center for Information Systems Research (CISR)

Stephanie L. Woerner, Research Scientist, MIT Center for Information Systems Research (CISR)
MIT CENTER FOR INFORMATION SYSTEMS RESEARCH (CISR)
Founded in 1974 and grounded in MIT's tradition of combining academic knowledge and practical purpose, MIT CISR helps executives meet the challenge of leading increasingly digital and data-driven organizations. We work directly with digital leaders, executives, and boards to develop our insights. Our research is funded by member organizations that support our work and participate in our consortium.