Close Cookie Notice

Welcome to the MIT CISR website!

This site uses cookies. Review our Privacy Statement.

Red briefing graphic
Research Briefing

Managing the IT Portfolio (Update Circa 2009): Infrastructure Dwindling in the Downturn

IT portfolio management can help executives take an enterprise-wide view using four investment objectives for IT.
By Peter Weill, Stephanie L. Woerner, and Mark McDonald
Abstract

IT portfolio management can help executives take an enterprise-wide view using four investment objectives for IT.

In many firms, the downturn has put severe pressure on all budgets and IT is no exception. However, in a global survey of 1541 firms, we found that 43% of firms in the study increased their IT budgets, 19% reduced budgets and the rest stayed about the same.[foot]This briefing draws on data from the Gartner Executive Programs 2009 CIO Survey. MIT CISR collaborated on the design of some questions in this survey.[/foot] 

There is significant variation among industries and geographies. For instance, one oil company we talked to cut its IT budget by 40% and in financial services, the average IT budget is down 11%. IT budgets, however, are up 14% in Brazil and 20% in India. The good news across the world is that IT infrastructure comprises an ever-decreasing percentage of the IT budget, giving IT organizations additional new investment opportunities. Effectively managing these opportunities and pressures on IT budgets requires an enterprise-wide view. 

One tool that can help executives take an enterprise-wide view is IT portfolio management. Portfolio management uses a familiar language, based on financial portfolio management. More importantly, it provides a common vehicle for prioritization and consolidation across the entire business. Using the MIT CISR IT portfolio framework, this briefing presents 2009 benchmarks for IT portfolios from the Gartner Executive Programs 2009 CIO survey. The briefing highlights how infrastructure is rapidly shrinking and where the freed up IT budgets are being spent. 

IT Spending in 2009 

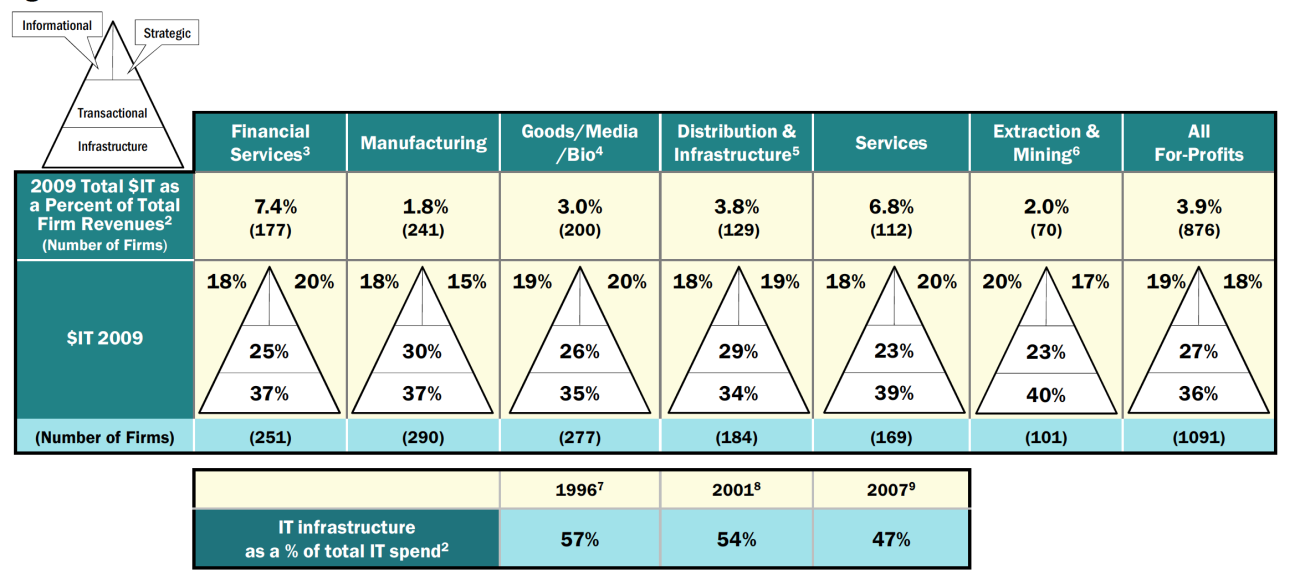
Just as investors address their objectives for risk and return using portfolios of financial investments, firms use IT portfolio management to better enable their management teams to match IT investments to their strategic objectives. To effectively manage any portfolio, all investments must be included. The IT portfolio encompasses total IT spending in the enterprise (operating expenses plus capital depreciation) including all technology, services, digitized information, outsourcing, and people dedicated to IT. The average firm is spending 3.9% of revenues on IT in 2009 (see Figure 1). Average IT spending varies significantly by industry with extracting and mining firms allocating 2% of revenues to IT whereas banks spend 7.4%. 

Four Asset Classes 

Our research has found that executives have four different management objectives for investing in IT: 

  • Transactional—cut costs or increase throughput typically by automating the repetitive transactions of the firm (e.g., billing system or insurance renewal); 
  • Informational—provide information for any purpose including to account, manage, control, report, communicate, comply, or analyze (e.g., sales analysis, six sigma, government reporting); 
  • Strategic—gain competitive advantage or position in the market place (e.g., iPhone’s app ecosystem); 
  • Infrastructure—provides the foundation of shared IT services used by multiple applications (e.g., servers, networks, laptops, customer databases—excludes applications). 

Spending to achieve the four management objectives becomes an IT portfolio with four asset classes. Infrastructure is the base of the portfolio, providing IT capability to support the applications above (see Figure 1). In 2009 the average firm in our study allocated only 36% of its total IT spending to infrastructure. Transactional systems use the IT infrastructure and account for 27% of IT spending. The informational and strategic systems typically build on both the transactional and infrastructure capability, accounting for 18% and 19% of IT spending, respectively. Any particular project or system can span more than one management objective depending on the combination of its strategic goals and the installed IT. 

    Figure 1: 2009 IT Portfolios in Different Industries[1]

    1 Source of Data: Gartner Executive Programs 2009 CIO Survey, N=1541.
    2 Framework: “Generating Premium Returns on Your IT Investments,” P. Weill
    3 Financial Services: Investment Banking, Financial Services, and Insurance.
    information technology, P. Weill and M. Broadbent, HBS Press, 1998.
    4 Goods/Media/Bio: Wholesale, Retail, Media and Entertainment Services, Health Care and Pharmaceuticals.
    5 Distribution and Infrastructure: Telecom, Utilities, and Transportation
    6 Extraction and Mining: Agriculture, Mining, Construction, and Oil & Gas.
    and S. Aral, MIT Sloan Management Review, Vol. 47, No. 2, Winter 2006.
    7 Leveraging the New Infrastructure: How market leaders capitalize on
    8 MIT CISR See IT Survey (140 firms).
    9 MIT CISR 2007 survey (1508 firms).

    What’s Happened to the Infrastructure? 

    Over the 13 years we have been collecting this data, the percentage of the total IT budget spent on infrastructure has plummeted from 57% (1996) to 36% (2009)—see the bottom of Figure 1. This 37% drop in infrastructure costs comes from many sources including: 

    • Increase in IT power per dollar (e.g., Moore’s Law) 
    • Infrastructure consolidation (e.g., data center consolidation, server virtualization, etc.) 
    • IT outsourcing (to service providers with better economies of scale) 
    • Business process outsourcing (where the infrastructure supporting the business process is no longer needed within the firm) 

    For example, premium car maker BMW created a Global Infrastructure Operations Group that consolidated infrastructure across the functions and geographies. BMW’s percent of the total IT budget spent on IT infrastructure has dropped from 42% to 35% over the last three years. IT infrastructure services design, infrastructure operations consolidation, and vendor consolidation were key initiatives in this success. BMW moved from 300+ unmanaged budget line items to 41 defined, measured, and delivered services while reducing from 212 external infrastructure partners to seven. 

    Using Portfolios to Manage IT Investments

    Typically IT portfolios are used by executive committees to analyze the proposed IT spend. The dollars for each IT project or service are allocated by percentages into the four asset classes and consolidated into a single portfolio for the business unit or firm. Senior management then analyzes the portfolio, assessing fit with both strategy and risk. Opportunities for consolidation, sharing and reuse are identified. 

    To use portfolios, we suggest that a firm classify its planned IT investments into the four asset classes and then analyze its relative position. Questionnaires are available from MIT CISR to classify a business’ IT investment. Compare your proposed portfolio to the appropriate industry portfolio in Figure 1 and ask: Can we explain the difference between our portfolio size and allocation and the industry average by our strategy? 

    Where Are Top Performers Investing in IT?

    To help answer the question above, we analyzed how top performers are allocating their IT dollars in 2009.[foot]Top performers had above averages scores in business value from IT which is positively correlated to several industry adjusted measures of firm performance such as ROE.[/foot] Even as top performers on average increased their IT budgets by 6.7% from 2008, they reallocated their IT spending to focus on business priorities like revenue generation and consolidation of business operations. Figure 2 presents some of the top business and IT priorities identified by CIOs in 2009 and the impact on the IT portfolios of top performers. 

    Figure 2: Business and IT Priorities Influence IT Portfolio Allocations in Top Performers[1]

    1 Source: Gartner Executive Programs 2009 CIO Survey, N=1541.
    2 Top performers with these priorities were statistically significantly investing more (↑) or less (↓) in these areas. Top performers had above averages scores in business value from IT which is positively correlated to several industry adjusted measures of firm performance such as ROE.

    A key distinction in the IT portfolio is the classification between New versus Run spending. Run spending keeps the current systems running and includes regular maintenance and updating—keeping the lights on. New spending includes all new business initiatives and major changes to applications and business processes, including new infrastructure. In 2007, the average firm spent 66% of its IT budget on Run—in 2009 this dropped to 62%. This is very good news as we found firms spending more of their IT budgets on New rather than Run had significantly higher revenue growth and net margins relative to their competitors.[foot]“Managing the IT Portfolio (update circa 2008): It’s All About What’s New,” P. Weill, S. Woerner, and H. Rubin, MIT Sloan CISR Research Briefing, Vol. VIII, No. 2B, July 2008, https://cisr.mit.edu/publication/2008_07_2B-ITPortfolio-Weill%2BWoerner%2BRubin.[/foot] For BMW one of the benefits of their infrastructure consolidation has been a shift in how they spend their IT dollars. Over the last three years BMW has reduced the percentage of its IT budget spent on Run from 62% to 51%, freeing up IT resources to focus on creating new business value in areas such as engineering, sales, and distribution. 

    We suggest you study Figures 1 and 2 and compare them to how you are spending your IT dollars in 2009. 

    About the Authors

    MIT CISR Researcher

    Mark McDonald, Group Vice President, Gartner Inc.

    MIT CENTER FOR INFORMATION SYSTEMS RESEARCH (CISR)

    Founded in 1974 and grounded in MIT's tradition of combining academic knowledge and practical purpose, MIT CISR helps executives meet the challenge of leading increasingly digital and data-driven organizations. We work directly with digital leaders, executives, and boards to develop our insights. Our consortium forms a global community that comprises more than seventy-five organizations.

    MIT CISR Patrons
    AlixPartners
    Avanade
    Axway, Inc.
    Collibra
    IFS
    Pegasystems Inc.
    The Ogilvy Group
    MIT CISR Sponsors
    Alcon Vision
    Amcor
    ANZ Banking Group (Australia)
    AustralianSuper
    Banco Bradesco S.A. (Brazil)
    Banco do Brasil S.A.
    Bank of Queensland (Australia)
    Barclays (UK)
    BlueScope Steel (Australia)
    BNP Paribas (France)
    Bupa
    CarMax
    Caterpillar, Inc.
    Cemex (Mexico)
    Cencora
    Cochlear Limited (Australia)
    Commonwealth Superannuation Corp. (Australia)
    Cuscal Limited (Australia)
    CVS Health
    Dawn Foods
    DBS Bank Ltd. (Singapore)
    Doosan Corporation (Korea)
    Fidelity Investments
    Fomento Economico Mexicano, S.A.B., de C.V.
    Fortum (Finland)
    Genentech
    Gilbane Building Co.
    Johnson & Johnson (J&J)
    Kaiser Permanente
    King & Wood Mallesons (Australia)
    Koç Holding (Turkey)
    Mercer
    Nasdaq, Inc.
    NN Insurance Eurasia NV
    Nomura Holdings, Inc. (Japan)
    Nomura Research Institute, Ltd. Systems Consulting Division (Japan)
    Novo Nordisk A/S (Denmark)
    OCP Group
    Pacific Life Insurance Company
    Posten Bring AS (Norway)
    Principal Life Insurance Company
    QBE
    Ramsay Health Care (Australia)
    Raytheon Technologies
    Scentre Group Limited (Australia)
    Schneider Electric Industries SAS (France)
    Stockland (Australia)
    Tabcorp Holdings (Australia)
    Telstra Limited (Australia)
    Terumo Corporation (Japan)
    Tetra Pak (Sweden)
    Truist Financial Corporation
    UniSuper Management Pty Ltd (Australia)
    Uniting (Australia)
    USAA
    Webster Bank, N.A.
    Westpac Banking Corporation (Australia)
    WestRock Company
    Wolters Kluwer
    Xenco Medical
    Zoetis Services LLC

    MIT CISR Associate Members

    MIT CISR wishes to thank all of our associate members for their support and contributions.

    Find Us
    Center for Information Systems Research
    Massachusetts Institute of Technology
    Sloan School of Management
    245 First Street, E94-15th Floor
    Cambridge, MA 02142
    617-253-2348